codecamp

jQuery EasyUI 数据网格 – 创建页脚摘要

jQuery EasyUI 数据网格 - 创建页脚摘要

在本节的示例中,我们将向您展示如何在jQuery EasyUI数据网格(datagrid)中创建页脚摘要,以显示摘要信息行。
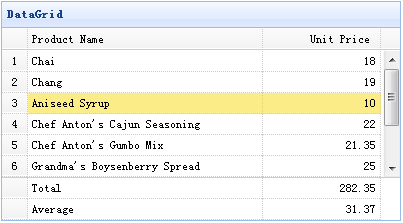
为了显示页脚行,您应该将showFooter属性设置为true,然后准备定义在数据网格数据中的页脚行。以下是示例数据:

	{"total":1,"rows":[{"id":1,"name":"Chai","price":18.00}],"footer":[{"name":"Total","price":18.00}]}

创建数据网格(DataGrid)

	<table id="tt" title="DataGrid" class="easyui-datagrid" style="width:400px;height:250px" 	
            url="data/datagrid17_data.json" 			
            fitColumns="true" rownumbers="true" showFooter="true">
		<thead>
			<tr>
				<th field="name" width="80">Product Name</th>
				<th field="price" width="40" align="right">Unit Price</th>
			</tr>
		</thead>
	</table>

页脚行和显示数据行一样,所以您可以在页脚显示不止一个摘要信息。

下载 jQuery EasyUI 实例

jeasyui-datagrid-datagrid17.zip

jQuery EasyUI 数据网格 – 创建自定义视图
jQuery EasyUI 数据网格 – 条件设置行背景颜色
温馨提示
下载编程狮App,免费阅读超1000+编程语言教程
取消
确定
目录

jQuery EasyUI 教程

关闭

MIP.setData({ 'pageTheme' : getCookie('pageTheme') || {'day':true, 'night':false}, 'pageFontSize' : getCookie('pageFontSize') || 20 }); MIP.watch('pageTheme', function(newValue){ setCookie('pageTheme', JSON.stringify(newValue)) }); MIP.watch('pageFontSize', function(newValue){ setCookie('pageFontSize', newValue) }); function setCookie(name, value){ var days = 1; var exp = new Date(); exp.setTime(exp.getTime() + days*24*60*60*1000); document.cookie = name + '=' + value + ';expires=' + exp.toUTCString(); } function getCookie(name){ var reg = new RegExp('(^| )' + name + '=([^;]*)(;|$)'); return document.cookie.match(reg) ? JSON.parse(document.cookie.match(reg)[2]) : null; }