
配置篇-suricata.yaml-1
suricata版本为4.0.3
user and group
用于设置启动suricata的用户及其分组。
# Run suricata as user and group.
# run-as:
#  user: suri
#  group: suri
max-pending-packets
该选项设置了suricata能够同时处理的数据包的数量,最少为1,最大值取决于内存的大小,更大的内存可以设置更大的值并拥有更好的性能,默认值是1024。但是官方文档中并没有指出其数量与内存之间的具体关系。设置格式为:
# Number of packets preallocated per thread. The default is 1024. A higher number
# will make sure each CPU will be more easily kept busy, but may negatively
# impact caching.
#
# If you are using the CUDA pattern matcher (mpm-algo: ac-cuda), different rules
# apply. In that case try something like 60000 or more. This is because the CUDA
# pattern matcher buffers and scans as many packets as possible in parallel.
# max-pending-packets: 1024
runmodes
该选项设置了suricata的运行方式,使用命令./suricata --list-runmodes可以查看所有的运行方式,部分截图如下:

在介绍运行方式(Runmodes)之前首先了解一下suricata的基本组成。Suricata是由所谓的线程(threads)、线程模块 (thread-modules)和队列(queues)组成。Suricata是一个多线程的程序,因此在同一时刻会有多个线程在工作。线程模块是依据 功能来划分的,比如一个模块用于解析数据包,另一个模块用于检测数据包等。每个数据包可能会有多个不同的线程进行处理,队列就是用于将数据包从一个线程传 递到另一个线程。与此同时,一个线程可以拥有多个线程模块,但是在某一时刻只有一个模块在运行(原文是If they have more modules, they can only be active on a a time.看不大懂,感觉是这个意思)。
Suricata的运行方式就是上面介绍的线程(threads)、线程模块(thread-modules)和队列(queues)三种元素的不 同组合方式。上图中的RunMode Type并不是配置文件中的runmodes选项,而是后面的Custom Mode也就是自定义模式才可以在此处设置。比如默认的Runmodes是autofp,在线实时检测流量的模式中其结构如下,单线程模块获取数据包和解 码,多线程模块检测,单模块输出:

而在pfring模式下的autofp则有所不同,可以看到它有多个模块获取及解码数据包,通过流绑定队列分配到多个检测模块中进行检测,这应该是pfring模式获取数据包效率更高的原因:

default-packet-size
之前的max-pending-packets选项设置了最多同时处理的数据包数量,这些同时处理的数据包都是需要存储在内存中的,所以需要对每个 数据包的大小进行限制,而当前选项就是做这个事的。虽然有时候可能需要检测较大的数据包,但是大部分情况下为了性能还是需要做出一定的限制。其配置方式如 下,默认值是1514,这也是TCP数据包的最大长度(当数据超过这个长度便会使用TCP报文重组技术):
# Preallocated size for packet. Default is 1514 which is the classical
# size for pcap on ethernet. You should adjust this value to the highest
# packet size (MTU + hardware header) on your system.
#default-packet-size: 1514
action-order
action指的是每条规则匹配时需要执行的操作,比如下面这条规则执行alert警告操作:

而当前字段设置的是多条规则同时匹配的时候的执行顺序。action共有四种:pass、drop、reject、alert。
pass   指的是处理的数据包匹配当前规则时直接跳过后面的所有规则,也就是说不匹配后面的规则
drop   只能工作在 IPS 模式下,当数据包匹配到 drop 的规则时则会被丢弃并且产生一个警告
reject 会给数据包的发送和接收端都发生一个拒绝的数据包,如果原本的协议是TCP,则发生reset数据包,
       否则发送 ICMP 错误的数据包,同时产生一个警告。在 IPS 模式下也会丢弃匹配到的数据包
alert  则对发送和接收者都没有影响,只会生成一个警告
Suricata按照规则的出现顺序依次加载,但是处理的顺序则根据配置文件中设置的action重要程度来排列。默认的顺序如下,
表示当一个数据包匹配多条规则时,优先处理的是pass的规则,其次是drop,然后是reject,最后是alert:
action-order:
 - pass
 - drop
 - reject
 - alert
default-log-dir
Suricata 默认的日志存储目录是 /var/log/suricata,在配置文件中可以通过当前选项指定,比如程序目录下的log文件夹,也可以在运行时的-l参数指定:
# The default logging directory.  Any log or output file will be
# placed here if its not specified with a full path name. This can be
# overridden with the -l command line parameter.
default-log-dir: /var/log/suricata/
outputs
outputs选项下有很多可以输出的配置选项,包括警告、检测的数据包、产生的结果等。在配置的过程中并不需要开启每一种输出,根据自己的需求进行配置。
警告输出(fast.log)
这个日志输出由单行的警告信息组成,比如下面这个输出例子由四个警告组成:
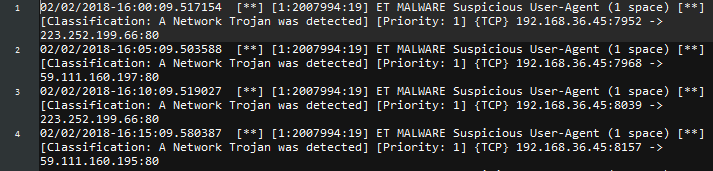
其配置如下:
# a line based alerts log similar to Snort's fast.log
- fast:
    enabled: yes
    filename: fast.log
    append: yes
    #filetype: regular # 'regular', 'unix_stream' or 'unix_dgram'
事件输出(eve.log)
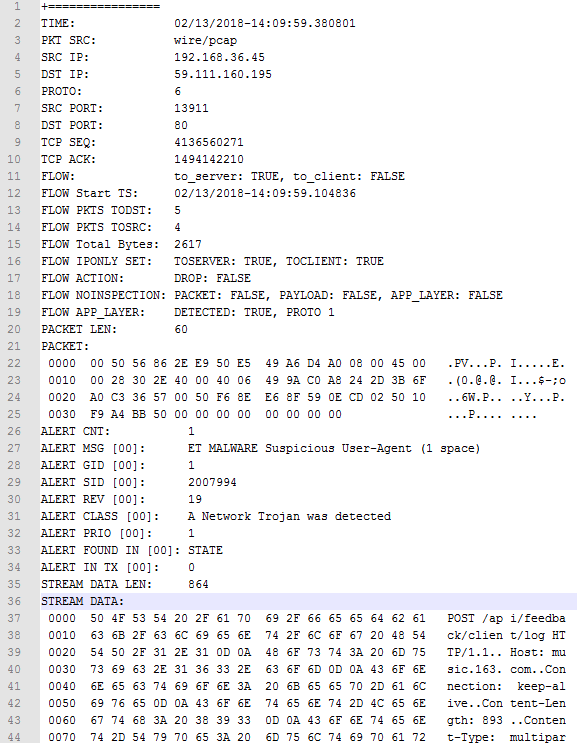
Suricata可以在匹配一条规则后记录一条信息,该条信息包括数据包的时间戳、五元组信息、对应的签名信息等,默认存储在日志目录下的 eve.log文件中。下面是几条典型的eve日志,这些日志是json格式的,因此很多其他的程序可以对其进行处理产生进一步的输出:

可以对其进行如下配置,输出的类型可以多种多样,包括文件、系统日志、输出到 socket 等,输出的内容可以包括匹配到有 alert、http、 dns 等规则的数据包信息。简单的说比如一条规则的 action 是 alert,检测到有一个数据包匹配这条规则,那数据包和规则的信息则会储存到事件日志中:
  # Extensible Event Format (nicknamed EVE) event log in JSON format
  - eve-log:
      enabled: yes
      filetype: regular #regular|syslog|unix_dgram|unix_stream|redis
      filename: eve.json
      #prefix: "@cee: " # prefix to prepend to each log entry
      # the following are valid when type: syslog above
      #identity: "suricata"
      #facility: local5
      #level: Info ## possible levels: Emergency, Alert, Critical,
                   ## Error, Warning, Notice, Info, Debug
      #redis:
      #  server: 127.0.0.1
      #  port: 6379
      #  async: true ## if redis replies are read asynchronously
      #  mode: list ## possible values: list|lpush (default), rpush, channel|publish
      #             ## lpush and rpush are using a Redis list. "list" is an alias for lpush
      #             ## publish is using a Redis channel. "channel" is an alias for publish
      #  key: suricata ## key or channel to use (default to suricata)
      # Redis pipelining set up. This will enable to only do a query every
      # 'batch-size' events. This should lower the latency induced by network
      # connection at the cost of some memory. There is no flushing implemented
      # so this setting as to be reserved to high traffic suricata.
      #  pipelining:
      #    enabled: yes ## set enable to yes to enable query pipelining
      #    batch-size: 10 ## number of entry to keep in buffer
      types:
        - alert:
            # payload: yes             # enable dumping payload in Base64
            # payload-buffer-size: 4kb # max size of payload buffer to output in eve-log
            # payload-printable: yes   # enable dumping payload in printable (lossy) format
            # packet: yes              # enable dumping of packet (without stream segments)
            # http-body: yes           # enable dumping of http body in Base64
            # http-body-printable: yes # enable dumping of http body in printable format
            metadata: yes              # add L7/applayer fields, flowbit and other vars to the alert

            # Enable the logging of tagged packets for rules using the
            # "tag" keyword.
            tagged-packets: yes

            # HTTP X-Forwarded-For support by adding an extra field or overwriting
            # the source or destination IP address (depending on flow direction)
            # with the one reported in the X-Forwarded-For HTTP header. This is
            # helpful when reviewing alerts for traffic that is being reverse
            # or forward proxied.
            xff:
              enabled: no
              # Two operation modes are available, "extra-data" and "overwrite".
              mode: extra-data
              # Two proxy deployments are supported, "reverse" and "forward". In
              # a "reverse" deployment the IP address used is the last one, in a
              # "forward" deployment the first IP address is used.
              deployment: reverse
              # Header name where the actual IP address will be reported, if more
              # than one IP address is present, the last IP address will be the
              # one taken into consideration.
              header: X-Forwarded-For
        - http:
            extended: yes     # enable this for extended logging information
            # custom allows additional http fields to be included in eve-log
            # the example below adds three additional fields when uncommented
            #custom: [Accept-Encoding, Accept-Language, Authorization]
        - dns:
            # control logging of queries and answers
            # default yes, no to disable
            query: yes     # enable logging of DNS queries
            answer: yes    # enable logging of DNS answers
            # control which RR types are logged
            # all enabled if custom not specified
            #custom: [a, aaaa, cname, mx, ns, ptr, txt]
        - tls:
            extended: yes     # enable this for extended logging information
            # output TLS transaction where the session is resumed using a
            # session id
            #session-resumption: no
            # custom allows to control which tls fields that are included
            # in eve-log
            #custom: [subject, issuer, session_resumed, serial, fingerprint, sni, version, not_before, not_after, certificate, chain]
        - files:
            force-magic: no   # force logging magic on all logged files
            # force logging of checksums, available hash functions are md5,
            # sha1 and sha256
            #force-hash: [md5]
        #- drop:
        #    alerts: yes      # log alerts that caused drops
        #    flows: all       # start or all: 'start' logs only a single drop
        #                     # per flow direction. All logs each dropped pkt.
        - smtp:
            #extended: yes # enable this for extended logging information
            # this includes: bcc, message-id, subject, x_mailer, user-agent
            # custom fields logging from the list:
            #  reply-to, bcc, message-id, subject, x-mailer, user-agent, received,
            #  x-originating-ip, in-reply-to, references, importance, priority,
            #  sensitivity, organization, content-md5, date
            #custom: [received, x-mailer, x-originating-ip, relays, reply-to, bcc]
            # output md5 of fields: body, subject
            # for the body you need to set app-layer.protocols.smtp.mime.body-md5
            # to yes
            #md5: [body, subject]

        #- dnp3
        #- nfs
        - ssh
        - stats:
            totals: yes       # stats for all threads merged together
            threads: no       # per thread stats
            deltas: no        # include delta values
        # bi-directional flows
        - flow
        # uni-directional flows
        #- netflow
        # Vars log flowbits and other packet and flow vars
        #- vars
当然也可以把不同类别的信息输出到不同的日志文件中,如下配置表明 alert 和 drop 输出到 eve-ips.json,http 等协议输出到 eve-nsm.json:
outputs:
  - eve-log:
      enabled: yes
      filetype: regular #regular|syslog|unix_dgram|unix_stream|redis
      filename: eve-ips.json
      types:
        - alert
        - drop

  - eve-log:
      enabled: yes
      filetype: regular #regular|syslog|unix_dgram|unix_stream|redis
      filename: eve-nsm.json
      types:
        - http
        - dns
- tls还有一些其他的输出方法及格式可以参考EveJSONFormat。
数据包输出(unified2.alert)
当suricata检测到一个可疑的数据包时便可以将整个数据包以二进制的方式存储到文件中,目前已经支持了IPv4和IPv6的数据包。其输出的格式可以被Barnyard2 (参考网页)程序处理,这是一个用于将suricata输出的包存储到数据库中的程序,可以配合 Sguil(参考网页)进行对网络流量的实时监控和输出。一般上的配置格式如下,由于这里对每个文件的大小有32M的限制,所以在文件大于这个值时便会新建一个文件继续存储:
  # alert output for use with Barnyard2
  - unified2-alert:             # The log-name.
      enabled: yes              # This log is enabled. Set 'no' to disable.
      filename: unified2.alert  # The name of the file in the default logging directory.

      # File size limit.  Can be specified in kb, mb, gb.  Just a number
      # is parsed as bytes.
      #limit: 32mb

      # By default unified2 log files have the file creation time (in
      # unix epoch format) appended to the filename. Set this to yes to
      # disable this behaviour.
      #nostamp: no

      # Sensor ID field of unified2 alerts.
      #sensor-id: 0

      # Include payload of packets related to alerts. Defaults to true, set to
      # false if payload is not required.
      #payload: yes
在这个选项里还有一个X-Forwarded-For功能,这个功能是用来记录经过多个HTTP代理服务器之后真正的客户端IP地址,而不是代理服 务器的IP地址,HTTP协议会在头里面加入一个X-Forwarded-For字段以记录原始IP以及经过的每个代理服务器的IP,详细可参考X-Forwarded-For-维基百科,无论是在客户端的代理还是服务端的反向代理(百度百科)都非常有用,默认是关闭的:
      # HTTP X-Forwarded-For support by adding the unified2 extra header or
      # overwriting the source or destination IP address (depending on flow
      # direction) with the one reported in the X-Forwarded-For HTTP header.
      # This is helpful when reviewing alerts for traffic that is being reverse
      # or forward proxied.
      xff:
        enabled: no
        # Two operation modes are available, "extra-data" and "overwrite". Note
        # that in the "overwrite" mode, if the reported IP address in the HTTP
        # X-Forwarded-For header is of a different version of the packet
        # received, it will fall-back to "extra-data" mode.
        mode: extra-data
        # Two proxy deployments are supported, "reverse" and "forward". In
        # a "reverse" deployment the IP address used is the last one, in a
        # "forward" deployment the first IP address is used.
        deployment: reverse
        # Header name where the actual IP address will be reported, if more
        # than one IP address is present, the last IP address will be the
        # one taken into consideration.
        header: X-Forwarded-For
HTTP日志(http.log)
HTTP日志会记录所有的HTTP流量信息,包含了http请求、HOST字段、URI字段和User-Agent字段,这里是普通的输出,除此之 外也可以在eve-log中指定http以便输出json格式的内容。另外也可以设置是否扩展以输出更多的信息,未扩展时输出的内容:

关于此项的配置如下,扩展选项默认关闭,用户还可以通过customformat来自定义输出的格式,同时也可以配置输出到socket文件:
  # a line based log of HTTP requests (no alerts)
  - http-log:
      enabled: yes
      filename: http.log
      append: yes        # If this option is set to yes, the last filled http.log-file will not be
                         # overwritten while restarting Suricata.
      #extended: yes     # enable this for extended logging information
      #custom: yes       # enabled the custom logging format (defined by customformat)
      #customformat: "%{%D-%H:%M:%S}t.%z %{X-Forwarded-For}i %H %m %h %u %s %B %a:%p -> %A:%P"
      #filetype: regular # 'regular', 'unix_stream' or 'unix_dgram'
还有一个存储 DNS 流量和 TLS 的配置,与 HTTP 的类似,详见 -tls-log 与 -dns-log, 这里就不做过多解释了。
数据包日志(pcap-log)
通过pcap-log选项可以保存所有的数据包,这样在检测到问题数据包时就能更容易地找到之前的流量以便对整个事件进行确认和分析。基本配置如 下,与之前的HTTP日志一样,pcap文件也是可以限定大小和文件数的,当一个文件达到限制的大小时便会创建一个新文件,同时这里还有文件数量的限制:
  # Packet log... log packets in pcap format. 3 modes of operation: "normal"
  # "multi" and "sguil".
  #
  # In normal mode a pcap file "filename" is created in the default-log-dir,
  # or are as specified by "dir".
  # In multi mode, a file is created per thread. This will perform much
  # better, but will create multiple files where 'normal' would create one.
  # In multi mode the filename takes a few special variables:
  # - %n -- thread number
  # - %i -- thread id
  # - %t -- timestamp (secs or secs.usecs based on 'ts-format'
  # E.g. filename: pcap.%n.%t
  #
  # Note that it's possible to use directories, but the directories are not
  # created by Suricata. E.g. filename: pcaps/%n/log.%s will log into the
  # per thread directory.
  #
  # Also note that the limit and max-files settings are enforced per thread.
  # So the size limit when using 8 threads with 1000mb files and 2000 files
  # is: 8*1000*2000 ~ 16TiB.
  #
  # In Sguil mode "dir" indicates the base directory. In this base dir the
  # pcaps are created in th directory structure Sguil expects:
  #
  # $sguil-base-dir/YYYY-MM-DD/$filename.<timestamp>
  #
  # By default all packets are logged except:
  # - TCP streams beyond stream.reassembly.depth
  # - encrypted streams after the key exchange
  #
  - pcap-log:
      enabled: yes
      filename: log.pcap

      # File size limit.  Can be specified in kb, mb, gb.  Just a number
      # is parsed as bytes.
      limit: 1000mb

      # If set to a value will enable ring buffer mode. Will keep Maximum of "max-files" of size "limit"
      max-files: 2000

      mode: normal # normal, multi or sguil.

      # Directory to place pcap files. If not provided the default log
      # directory will be used. Required for "sguil" mode.
      #dir: /nsm_data/

      #ts-format: usec # sec or usec second format (default) is filename.sec usec is filename.sec.usec
      use-stream-depth: no #If set to "yes" packets seen after reaching stream inspection depth are ignored. "no" logs all packets
      honor-pass-rules: no # If set to "yes", flows in which a pass rule matched will stopped being logged.
配置中的mode有两种情况,一个是普通的normal,会将文件存储在之前指定的日志存储目录,而sguil模式则需要sguil_base_dir选项指定目录,并且存储的文件按照日期划分目录,并加上时间戳:
$sguil-base-dir/YYYY-MM-DD/$filename.<timestamp>use-stream-depth选项,如果设为“yes”只会存储不大于stream.reassembly.depth长度的数据,后面的将会舍弃(在一个stream中),“no”则会存储所有的数据包。
详细的警告日志(alert-debug.log)
如果开启这一选项,suricata会记录每一个警告产生的详细信息,包括数据包、规则等各种信息。一个典型的输出如下所示,这些信息可以使得维护人员更快的排除误报、检查规则的问题等:
虽然这个功能非常有用,但是在生产环境中启动并不是一个明智的行为,它会在检测流时处理和输出大量的信息,导致性能有很大的下降,因此默认的配置是不开启的:
  # a full alerts log containing much information for signature writers
  # or for investigating suspected false positives.
  - alert-debug:
      enabled: no
      filename: alert-debug.log
      append: yes        # If this option is set to yes, the last filled fast.log-file will not be
                         # overwritten while restarting Suricata.
      #filetype: regular # 'regular', 'unix_stream' or 'unix_dgram'
Syslog
这个选项决定了是否将suricata的警告输出到syslog文件中,配置如下:
  # a line based alerts log similar to fast.log into syslog
  - syslog:
      enabled: no
      # reported identity to syslog. If ommited the program name (usually
      # suricata) will be used.
      #identity: "suricata"
      facility: local5  ## In this option you can set a syslog facility
      #level: Info      ## possible levels: Emergency, Alert, Critical,
## Error, Warning, Notice, Info, Debug可以看到syslog选项默认是关闭的,如果开启,facility字段表示产生日志的分类为local5。关于syslog日志处理系统的更多信息可以参考Syslog-维基百科。
Drop.log
当suricata工作在IPS模式下的时候,可以使用drop操作的规则,这些drop掉的数据包信息就会存储在drop.log文件中,配置如下:
  # a line based information for dropped packets in IPS mode
  - drop:
      enabled: no
      filename: drop.log
      append: yes        # If this option is set to yes, the last filled drop.log-file will not be
                         # overwritten while restarting Suricata. If set to 'no' the last filled drop.log file will be overwritten.
      #filetype: regular # 'regular', 'unix_stream' or 'unix_dgram'
检测引擎相关配置
detect-engine
Suricata在对流量检测之前需要将所有的规则签名加载到内存,而数据包在匹配规则时并不需要匹配所有的规则,事实上大量的规则是完全没必要匹 配的,比如当前数据包时基于UDP协议的,那TCP的所有规则都是没有必要匹配的。因此需要根据一定的依据对所有的规则进行分组,这样数据包只需要与符合 条件的分组内的所有规则进行匹配即可。而需要如何分组则是一个关键的问题。
下面是detect-engine的一种配置。profile选项有high、low和medium三种。high表示分组较多,但是会占用更多的 内存,性能也会更好;low则正好相反,占用更少的内存,性能也相对较差;medium是默认配置,是性能和内存使用的折中选择。除此之外高级用户可以在 custom-values字段自定义分组的配置,如下是根据数据包来源、源地址、目的地址、源端口、目的端口来进行分组,这些数字可以根据实际需要的性 能和需求进行调整:
# The detection engine builds internal groups of signatures. The engine
# allow us to specify the profile to use for them, to manage memory on an
# efficient way keeping a good performance. For the profile keyword you
# can use the words "low", "medium", "high" or "custom". If you use custom
# make sure to define the values at "- custom-values" as your convenience.
# Usually you would prefer medium/high/low.
#
# "sgh mpm-context", indicates how the staging should allot mpm contexts for
# the signature groups.  "single" indicates the use of a single context for
# all the signature group heads.  "full" indicates a mpm-context for each
# group head.  "auto" lets the engine decide the distribution of contexts
# based on the information the engine gathers on the patterns from each
# group head.
#
# The option inspection-recursion-limit is used to limit the recursive calls
# in the content inspection code.  For certain payload-sig combinations, we
# might end up taking too much time in the content inspection code.
# If the argument specified is 0, the engine uses an internally defined
# default limit.  On not specifying a value, we use no limits on the recursion.
detect:
  profile: medium
  custom-values:
    toclient-groups: 3
    toserver-groups: 25
  sgh-mpm-context: auto
  inspection-recursion-limit: 3000
数据包检测规则的分组图可以看得更清楚:

接下来是sgh-mpm-context,这个字段指明MPM算法使用的content是否公用。当其值为auto时,是否公用取决于配置文件中指 定MPM的算法,若为ac或ac-gfbs,则使用single模式,表示所有的规则分组使用单个MPM-content,其余算法则使用full模式, 每个分组拥有自己的MPM-content。而当sgh-mpm-context字段的值为single或full时则不受MPM算法的影响。关于 suricata的MPM机制可以参考fast_parttern,后面的配置也会做进一步的说明。
最后的inspection-recursion-limit则是为了减少suricata的出错次数,因为网络流量状况非常复杂,suricata难免会遇上无限循环或是递归地处理数据包的情况,这时指定一个最大值,当循环或递归次数大于这个值则停止处理当前数据包。
mpm-algo
之前已经了解过,suricata在content的多模匹配支持很多算法,不同的算法有不同的优缺点。设置如下,可选的算法包括ac, ac-bs, ac-cuda, ac-ks和hs:
# Select the multi pattern algorithm you want to run for scan/search the
# in the engine.
#
# The supported algorithms are:
# "ac"      - Aho-Corasick, default implementation
# "ac-bs"   - Aho-Corasick, reduced memory implementation
# "ac-cuda" - Aho-Corasick, CUDA implementation
# "ac-ks"   - Aho-Corasick, "Ken Steele" variant
# "hs"      - Hyperscan, available when built with Hyperscan support
#
# The default mpm-algo value of "auto" will use "hs" if Hyperscan is
# available, "ac" otherwise.
#
# The mpm you choose also decides the distribution of mpm contexts for
# signature groups, specified by the conf - "detect.sgh-mpm-context".
# Selecting "ac" as the mpm would require "detect.sgh-mpm-context"
# to be set to "single", because of ac's memory requirements, unless the
# ruleset is small enough to fit in one's memory, in which case one can
# use "full" with "ac".  Rest of the mpms can be run in "full" mode.
#
# There is also a CUDA pattern matcher (only available if Suricata was
# compiled with --enable-cuda: b2g_cuda. Make sure to update your
# max-pending-packets setting above as well if you use b2g_cuda.

mpm-algo: auto
PS:网上其他suricata的配置说明文档记载的算法为:b2g, b2gc, b2gm, b3g, wumanber, ac和ac-gfbs,有待了解新旧算法的特点。
CUDA(Compute United Device Architecture)
CUDA的翻译是统一计算设备架构,为的是让CPU和GPU在执行运算的时候发挥自身的优势,协同处理,详细可参考CUDA-维基百科。 由于这项技术是NVIDIA主导的,且出现时间并不长,因此suricata只是在MPM多模匹配中可以使用,并且只有在编译前的configure时加 入–enable-cuda才具有这项功能,并且目前其他的GPU并不支持这项功能。因此这里就不做过多介绍,等后面这项技术推广开来,便有更加实用的意义。
# Cuda configuration.
cuda:
  # The "mpm" profile.  On not specifying any of these parameters, the engine's
  # internal default values are used, which are same as the ones specified in
  # in the default conf file.
  mpm:
    # The minimum length required to buffer data to the gpu.
    # Anything below this is MPM'ed on the CPU.
    # Can be specified in kb, mb, gb.  Just a number indicates it's in bytes.
    # A value of 0 indicates there's no limit.
    data-buffer-size-min-limit: 0
    # The maximum length for data that we would buffer to the gpu.
    # Anything over this is MPM'ed on the CPU.
    # Can be specified in kb, mb, gb.  Just a number indicates it's in bytes.
    data-buffer-size-max-limit: 1500
    # The ring buffer size used by the CudaBuffer API to buffer data.
    cudabuffer-buffer-size: 500mb
    # The max chunk size that can be sent to the gpu in a single go.
    gpu-transfer-size: 50mb
    # The timeout limit for batching of packets in microseconds.
    batching-timeout: 2000
    # The device to use for the mpm.  Currently we don't support load balancing
    # on multiple gpus.  In case you have multiple devices on your system, you
    # can specify the device to use, using this conf.  By default we hold 0, to
    # specify the first device cuda sees.  To find out device-id associated with
    # the card(s) on the system run "suricata --list-cuda-cards".
    device-id: 0
    # No of Cuda streams used for asynchronous processing. All values > 0 are valid.
    # For this option you need a device with Compute Capability > 1.0.
    cuda-streams: 2