pyecharts Sanic
本指南介绍了如何在 Sanic 中使用 pyecharts。
Sanic 前后端分离
前后端分离可以使用动态更新数据,增量更新数据等功能。
Step 0: 安装 Sanic 的依赖
$ pip install SanicStep 1: 新建项目和 HTML 文件
新建一个项目文件夹(空的即可),新建 app.py、templates 文件夹以及在 templates 文件夹中新建 index.html。
index.html
<!DOCTYPE html>
<html>
<head>
    <meta charset="UTF-8">
    <title>Awesome-pyecharts</title>
    <script src="https://cdn.bootcss.com/jquery/3.0.0/jquery.min.js"></script>
    <script type="text/javascript" src="https://assets.pyecharts.org/assets/echarts.min.js"></script>

</head>
<body>
    <div id="bar" style="width:1000px; height:600px;"></div>
    <script>
        var chart = echarts.init(document.getElementById('bar'), 'white', {renderer: 'canvas'});

        $(
            function () {
                fetchData();
            }
        );

        function fetchData() {
            $.ajax({
                type: "GET",
                url: "http://127.0.0.1:8000/barChart",
                dataType: 'json',
                success: function (result) {
                    chart.setOption(JSON.parse(result));
                }
            });
        }
    </script>
</body>
</html>
Step 2: 编写 Sanic 和 pyecharts 的代码
注: 目前由于 json 数据类型的问题,无法将 pyecharts 中的 JSCode 类型的数据转换成 json 数据格式返回到前端页面中使用。因此在使用前后端分离的情况下尽量避免使用 JSCode 进行画图。
示例代码
from random import randrange

from sanic import Sanic
from sanic.response import json, html

from pyecharts import options as opts
from pyecharts.charts import Bar

# 初始化 Sanic
app = Sanic(__name__)


def bar_base() -> Bar:
    c = (
        Bar()
        .add_xaxis(["衬衫", "羊毛衫", "雪纺衫", "裤子", "高跟鞋", "袜子"])
        .add_yaxis("商家A", [randrange(0, 100) for _ in range(6)])
        .add_yaxis("商家B", [randrange(0, 100) for _ in range(6)])
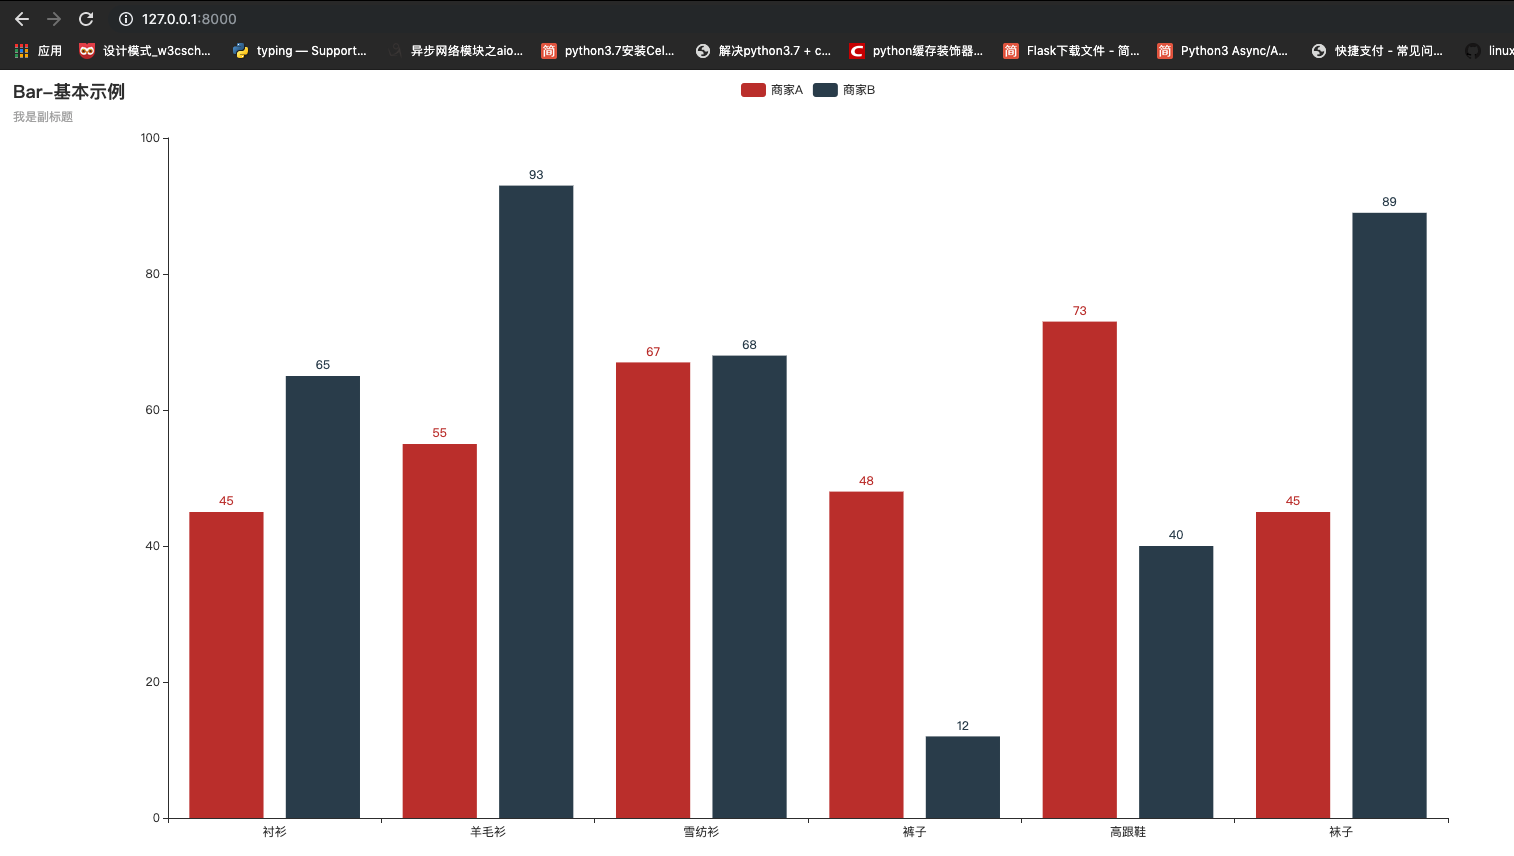
        .set_global_opts(title_opts=opts.TitleOpts(title="Bar-基本示例", subtitle="我是副标题"))
    )
    return c


@app.route("/barChart", methods=["GET"])
async def draw_bar_chart(request):
    c = bar_base()
    return json(c.dump_options_with_quotes())


@app.route("/", methods=["GET"])
async def index(request):
    return html(open("./templates/index.html").read())


if __name__ == '__main__':
    app.run()
Step 3: 运行项目
$ python app.py使用浏览器打开 http://127.0.0.1:8000 即可访问服务

定时全量更新图表
前端主动向后端进行数据刷新
定时刷新的核心在于 html 的 setInterval 方法。
index.html
<!DOCTYPE html>
<html>
<head>
    <meta charset="UTF-8">
    <title>Awesome-pyecharts</title>
    <script src="https://cdn.bootcss.com/jquery/3.0.0/jquery.min.js"></script>
    <script type="text/javascript" src="https://assets.pyecharts.org/assets/echarts.min.js"></script>

</head>
<body>
    <div id="bar" style="width:1000px; height:600px;"></div>
    <script>
        var chart = echarts.init(document.getElementById('bar'), 'white', {renderer: 'canvas'});

        $(
            function () {
                fetchData();
                setInterval(fetchData, 2000);
            }
        );

        function fetchData() {
            $.ajax({
                type: "GET",
                url: "http://127.0.0.1:8000/barChart",
                dataType: "json",
                success: function (result) {
                    chart.setOption(JSON.parse(result));
                }
            });
        }
    </script>
</body>
</html>
定时增量更新图表
index.html
<!DOCTYPE html>
<html>
<head>
    <meta charset="UTF-8">
    <title>Awesome-pyecharts</title>
    <script src="https://cdn.bootcss.com/jquery/3.0.0/jquery.min.js"></script>
    <script type="text/javascript" src="https://assets.pyecharts.org/assets/echarts.min.js"></script>

</head>
<body>
    <div id="bar" style="width:1000px; height:600px;"></div>
    <script>
        var chart = echarts.init(document.getElementById('bar'), 'white', {renderer: 'canvas'});
        var old_data = [];
        $(
            function () {
                fetchData();
                setInterval(getDynamicData, 2000);
            }
        );

        function fetchData() {
            $.ajax({
                type: "GET",
                url: "http://127.0.0.1:8000/lineChart",
                dataType: "json",
                success: function (result) {
                    chart.setOption(JSON.parse(result));
                    old_data = chart.getOption().series[0].data;
                }
            });
        }

        function getDynamicData() {
            $.ajax({
                type: "GET",
                url: "http://127.0.0.1:8000/lineDynamicData",
                dataType: "json",
                success: function (result) {
                    old_data.push([result.name, result.value]);
                    chart.setOption({
                        series: [{
                            data: old_data
                        }]
                    });
                }
            });
        }

    </script>
</body>
</html>
后端代码也需要相应的改变
from random import randrange

from sanic import Sanic
from sanic.response import json, html

from pyecharts import options as opts
from pyecharts.charts import Line

# 初始化 Sanic
app = Sanic(__name__)


def line_base() -> Line:
    line = (
        Line()
        .add_xaxis(list(range(10)))
        .add_yaxis(series_name="", y_axis=[randrange(0, 100) for _ in range(10)])
        .set_global_opts(
            title_opts=opts.TitleOpts(title="动态数据"),
            xaxis_opts=opts.AxisOpts(type_="value"),
            yaxis_opts=opts.AxisOpts(type_="value")
        )
    )
    return line


@app.route("/lineChart", methods=["GET"])
async def draw_line_chart(request):
    c = line_base()
    return json(c.dump_options_with_quotes())

cnt = 9

@app.route("/lineDynamicData", methods=["GET"])
async def update_line_data(request):
    global cnt
    cnt = cnt + 1
    return json({"name": cnt, "value": randrange(0, 100)})


@app.route("/", methods=["GET"])
async def index(request):
    return html(open("./templates/index.html").read())


if __name__ == '__main__':
    app.run()